
A web of genomes
Author
Dr Andre Kahles
ETH Zurich
The field of computational genomics lies at the heart of modern biomedical research, but what lies behind this complex name and how does the field help to advance biology and medicine? We will explain what genetic variation means and how researchers use it to explain differences between organisms and how computer scientist can help to prepare science for the next generation of genome sequencing.
Before we dive into exploring how computer science can help transform biomedical research, we need to take a step back and understand some of the central questions commonly asked in biomedical research and how this relates to genomes. So, let’s have a look at history. Already in 1958 Francis Crick, who would only a few years later be awarded with the Nobel prize, postulated the central dogma of molecular biology. This dogma states that all information in a biological system flows from DNA to RNA to protein. Where one end, the DNA, represents the set of molecules carrying the genetic code of an organisms, and the other, the proteins, correspond to the building blocks that form the molecular machines in each cell carrying out a diverse set of functions. Ultimately, a myriad of proteins within a vast number of cells will jointly work together to form what we see as an organism, or quite personally, as a human. But for each organism the above dogma holds and the determinants for how the organism is built can be found in the DNA molecules stored within each cell: the genome. Since the 1950s the dogma has not changed and only some more factors have been added. We have learned, for instance, that a genome does not exist without context: its environment influences how an organism develops.
Draw conclusions about an organism based on the genome
A central question of biomedical research is now how to best draw conclusions about the organism and its properties based on the genome it carries. For example, we could be interested to learn whether a certain drug is more efficient within one person than another, depending on their genome. Or we could ask, whether a certain genomic setup increases the chance for developing diseases such as cancer. To answer such questions and find relationships between certain genomic setups and an outcome of interest, a straightforward process is to compare the genomes of groups with each other that show different outcomes. In scientist’s lingo the genome setup of an organism is called the genotype and the observable properties of the organism, such as drug efficacy, is called the phenotype. So how do we predict one from another?
As a first step, we need to measure both ends. So, we need to assess the genotype of each organisms in our study and measure the associated phenotype. While the latter is often quite easy to do, measuring the genome has proven quite difficult initially. As getting information about the whole genome was difficult and expensive, one would start with only measuring certain positions of a genome one was interested in. This picture has changed now. Fortunately, the technology for sequencing the DNA present in one or many cells of an organism underwent drastic innovations over the past years. Today the process is robust and cost efficient. Measuring the whole genome of a human costs less than 1,000 CHF. (Just as a comparison. Sequencing the first human genome cost more than 15 Mio CHF.) Many countries have now started initiatives to measure the genome of tens of thousands of humans. This leads us to the part where computer science enters the stage.
Computer science helps to develop strategies to identify genomic variation
If we come back to our initial question of relating genotype and phenotype, then we still have to solve the task to compare the different genotypes of all individuals in our groups with each other. Giving the huge size of the human genome (3,200,000,000 positions) this is a daunting task. How shall we know which part is relevant? How can we find the part related to our outcome of interest? Luckily, the number of differences between any two humans is limited and more than 99.5% of the positions are identical. So what researchers do is to pick one genome sequence as a reference and describe all the other genomes relative to that. Practically, this means listing all positions that are different from the reference. (Which is still a list of several million positions for the non-identical 0.5%.) We will call the list of positions differing from the reference the genomic variation of an individual. For many years, computer scientists have helped to develop strategies to identify genomic variation based on a given reference genome, efficiently store it and statistically evaluate it.
With more and more genome measurements available, the strategy of picking a reference and describing all genomes as a list of differences reaches the limits of practicability. One problem for instance is to decide which genome is to be used as reference? Depending on your personal history, your genome will be typically more similar to someone whose familial roots are on the same continent as your family’s. To pick a single genome as a reference for all people on earth will represent some very well and others quite poorly. The question is now how to overcome such limitations and build a system that can represent the genomic variation of thousands of people in a way that it is both small and easy to access.
Genome graphs – useful concept to compare thousands of genomes at once
As for solving the initial problems arising from the work with single reference genomes, computer science is now again aiding to provide concepts that tackle this problem. A computer scientist would refer to a reference genome as a linear string, meaning an ordered sequence of characters (which for a genome would be A, C, G, and T; representing the four nucleotides). A useful concept often used in computer science and mathematics is that of a graph. Simply put, a graph is something like a network or a web, consisting of a set of nodes which can be connected through links, so-called edges. We can now use this concept to better represent multiple reference genomes at once. For this, imagine that we take our genomes and write them above each other. Each genome will be a line and the same positions in all genomes will be written right underneath each other. As large parts of the sequences are identical, we can combine blocks of identical lines into a single one. This will be a node in our graph. If we have multiple possibilities for a position, because genomes differ, we will just create multiple nodes for this position. If two nodes are neighboring in the input genomes, they will be connected with an edge in the graph. The concept is illustrated for an example in Figure 1. We will call this representation a genome graph.
With these genome graphs we can now reflect the variation of many thousands of genomes at once and compare against it at the same time. Current research focuses on how to translate computational approaches from a linear sequence to the genome graph, so we can use the same tools developed for the human reference genome also for the human reference graph. But one can also develop new tools that were impossible to realize in the past.
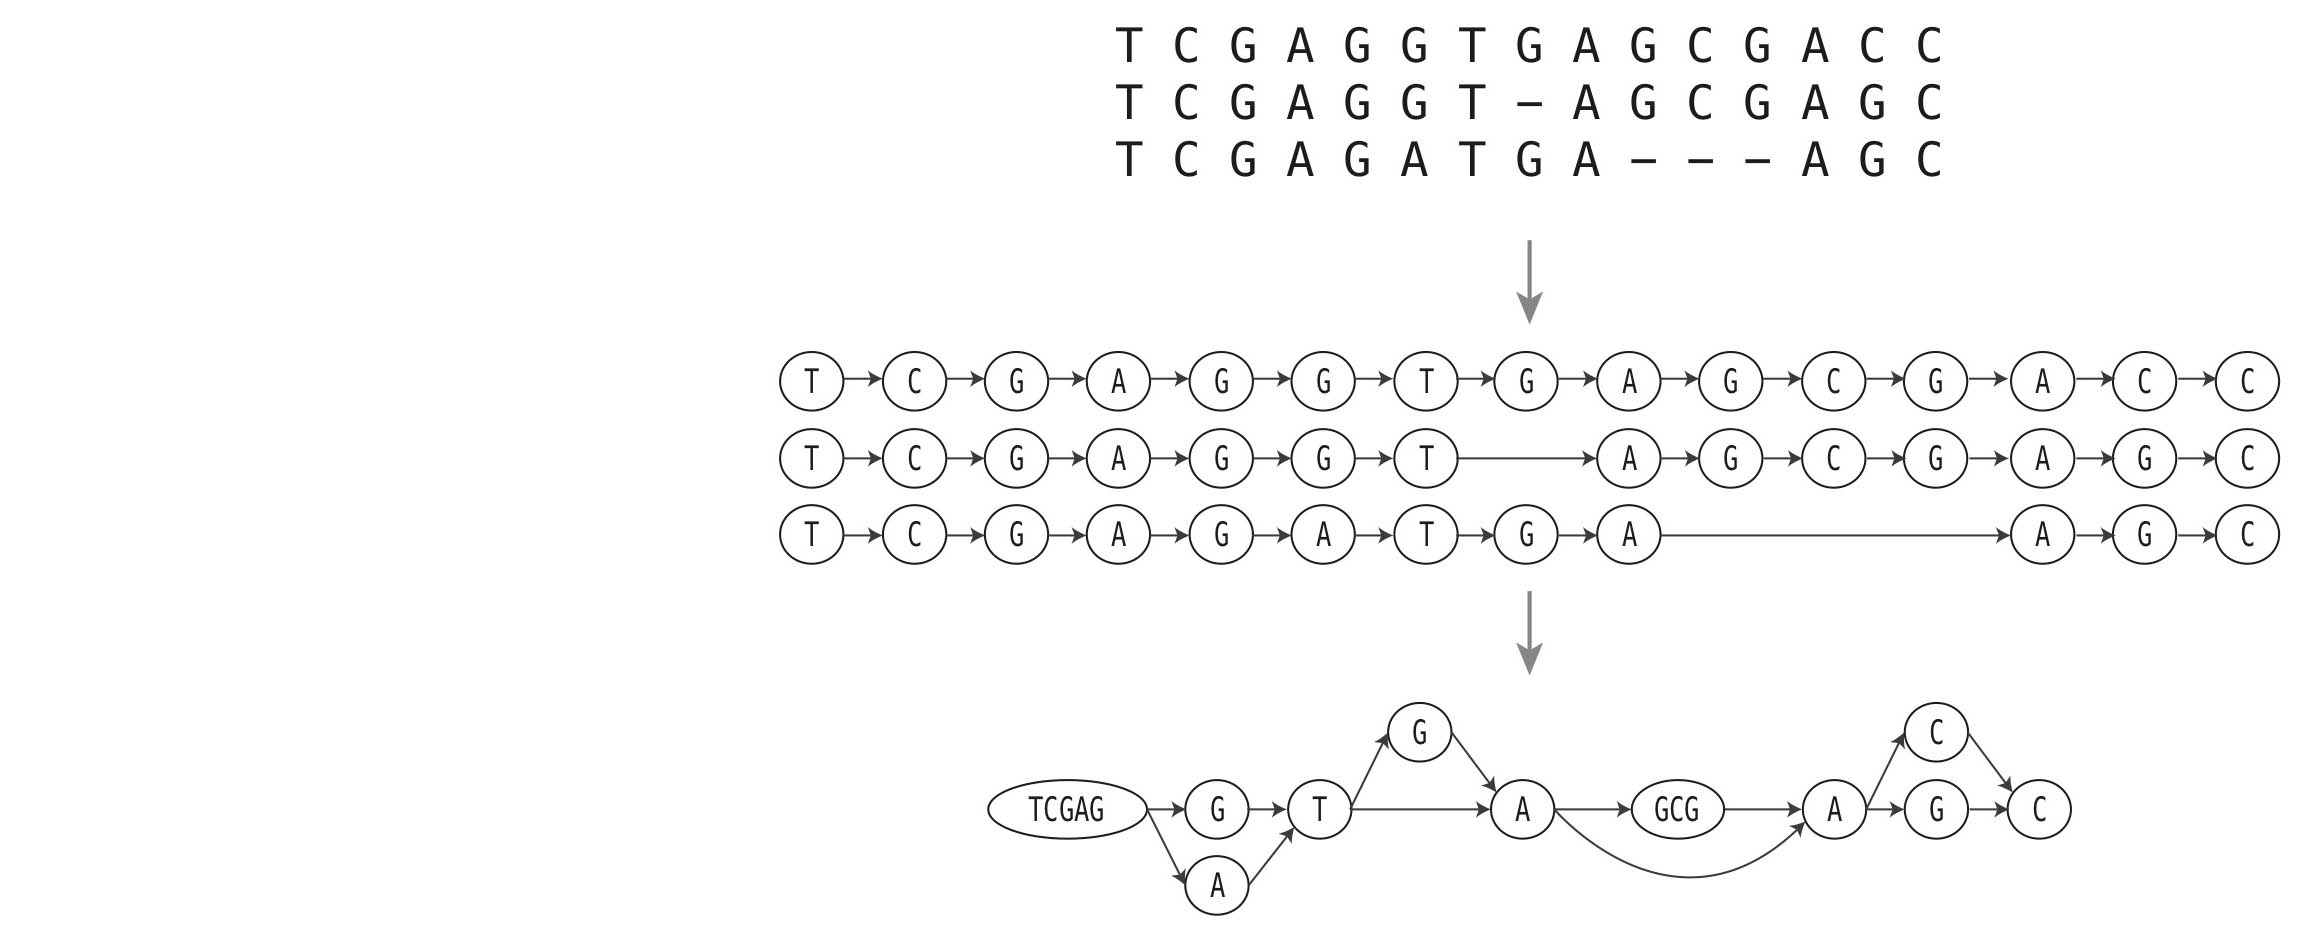
Figure 1: The top shows three short artificial genome sequences that are aligned to each other. Some positions differ and dashed refer to missing positions. The middle represents the three genomes as individual graphs. The bottom line shows the final graph representing all oft he genomes at once, each as a path from left to right.